

Overall Market Decline
The European new car market did not start 2026 on the best note. Registrations in the EU, UK, and European Free Trade Association (EFTA) countries fell by 3.5 percent compared to January last year, totaling 961,382 units. However, interesting trends and victories of individual brands are hidden behind this overall decline.
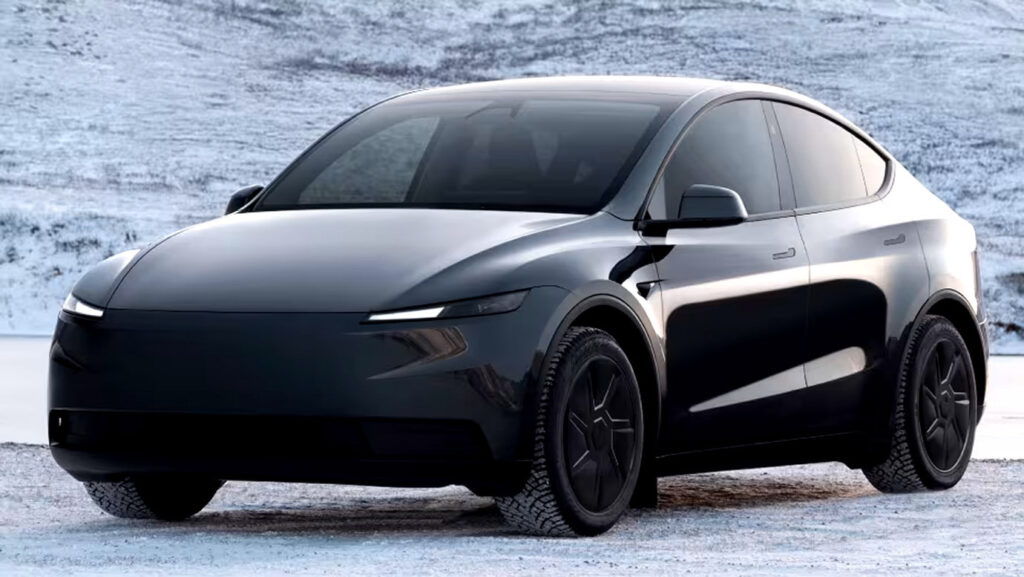
Tesla’s Decline Against the Backdrop of BYD’s Success
Surprisingly, Tesla was not a growth leader. On the contrary, Tesla car registrations in January fell by 17.0%, to 8,075 units. This is already the 13th consecutive month that sales of the American electric vehicle giant in Europe have been declining. Tesla’s market share shrank to 0.8%.
This is already the 13th consecutive month that sales of the American electric vehicle giant in Europe have been declining.
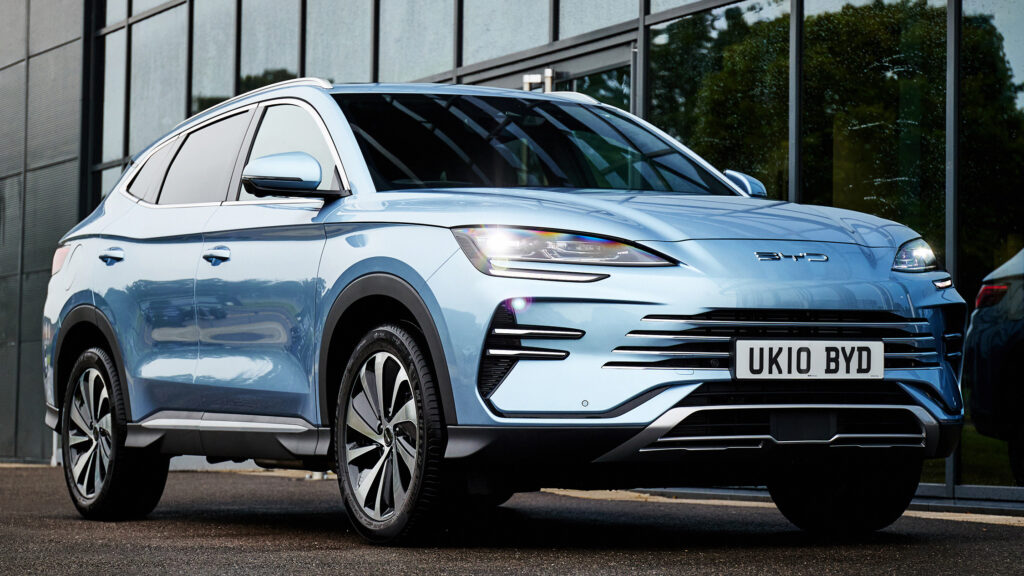
In contrast, the Chinese company BYD showed an impressive result. Sales of its electric and hybrid vehicles grew by 165.0% compared to January 2025, reaching 18,242 units. Thus, BYD’s market share was 1.9%, more than double that of Tesla.
Problems of Other Automakers
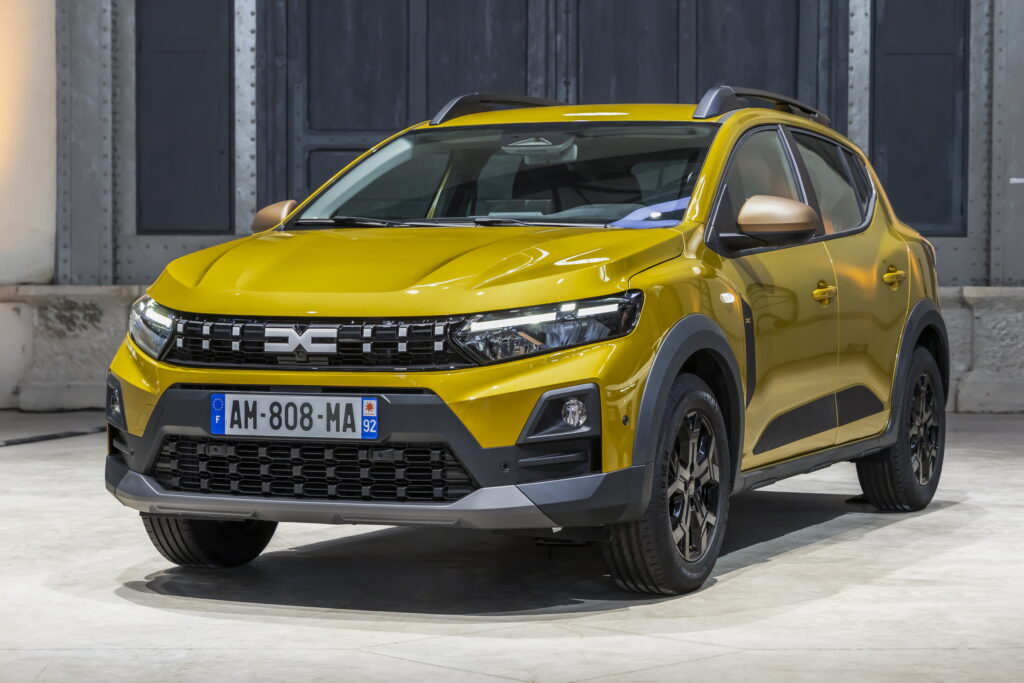

Tesla was far from the only manufacturer to experience a decline. Renault Group also showed negative dynamics: the group’s total sales fell by 15.0%. This happened mainly due to a catastrophic 35% drop in sales of the Dacia brand, despite a 4.4% increase in Renault’s own sales.
Among others who felt the decline were BMW (down 8.7%) and Volkswagen (down 11.2%). However, these conglomerates also had bright spots: Mini and Skoda increased sales by 11.2% and 10.1%, respectively.
Electrification Gains Momentum

Against the backdrop of the overall market decline, the electric vehicle segment continues to grow rapidly. Sales of battery electric vehicles (BEVs) increased by 13.9%, and they now account for 19.3% of the European market. Plug-in hybrid sales grew by 32.2%. At the same time, registrations of gasoline-powered cars fell by 25.7%, and diesel cars by 22.0%.
The situation in individual countries was mixed. In Germany and France, the total number of registrations fell by 6.6%, but electric car sales in these countries increased sharply – by 23.8% and 52.1%, respectively. Norway, which has always been a benchmark country for EVs, experienced a sharp 76.3% drop in total registrations, which is linked to the end of state incentives for electric vehicle buyers.
Detailed Sales Statistics
The table below clearly demonstrates the sales dynamics of major automakers and automotive groups in January 2026 compared to January 2025. The data covers the markets of the EU, UK, and EFTA.
Brand / Jan-26 / Jan-25 / Change / Market Share ’26 / Market Share ’25
Volkswagen Group / 256,728 / 266,798 / -3.8% / 26.7% / 26.8%
Stellantis / 164,436 / 154,161 / +6.7% / 17.1% / 15.5%
Renault Group / 83,201 / 97,890 / -15.0% / 8.7% / 9.8%
Hyundai Group / 72,893 / 83,283 / -12.5% / 7.6% / 8.4%
Toyota Group / 69,139 / 79,836 / -13.4% / 7.2% / 8.0%
BMW Group / 66,191 / 70,200 / -5.7% / 6.9% / 7.0%
Mercedes-Benz / 43,704 / 42,531 / +2.8% / 4.5% / 4.3%
Ford / 31,385 / 36,117 / -13.1% / 3.3% / 3.6%
Nissan / 20,570 / 25,010 / -17.8% / 2.1% / 2.5%
Volvo Cars / 20,367 / 23,680 / -14.0% / 2.1% / 2.4%
SAIC Motor / 19,254 / 19,611 / -1.8% / 2.0% / 2.0%
BYD / 18,242 / 6,884 / +165.0% / 1.9% / 0.7%
Tesla / 8,075 / 9,733 / -17.0% / 0.8% / 1.0%
These figures clearly indicate that the European market is undergoing a profound transformation. The success of BYD, which has surpassed Tesla not only in growth rates but also in the absolute number of cars sold, could be a turning point. This indicates that competition in the electric vehicle segment is intensifying, and former leaders can no longer count on unchallenged dominance. At the same time, the overall growth of the electric vehicle share to almost 20% confirms that the transition to electric power is a stable long-term trend, despite fluctuations at the level of individual brands. The future will show whether traditional European manufacturers can effectively resist the pressure of new Chinese players who combine technology with an attractive price.