

A new iSeeCars study, covering over 174 million vehicles, has identified the most reliable brands capable of reaching 250,000 miles (402,000 km).
Leaders in Longevity: Japanese Brands Are Unrivaled
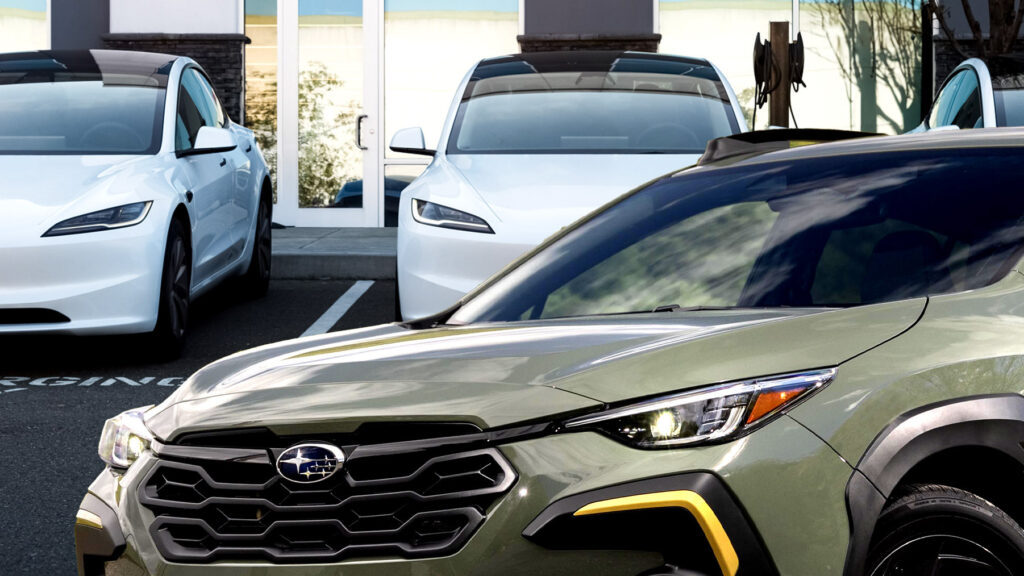
If you asked a room full of enthusiasts which brands are most likely to build a car capable of traveling 250,000 miles, most would probably name Toyota, Lexus, Honda, and Acura. And they would be right. But among the usual champions of reliability, a name that might surprise some buyers has sneaked in, especially those still worried about the lifespan of electric car batteries: Tesla.
According to a new iSeeCars study, Toyota confidently takes first place with a 17.8% chance of reaching a quarter-million miles. Lexus follows with a figure of 12.8%, while Honda and Acura complete the clean sweep of Japanese brand dominance. These are the only four manufacturers that exceed the overall industry average of 4.8%.
Tesla Challenges EV Stereotypes
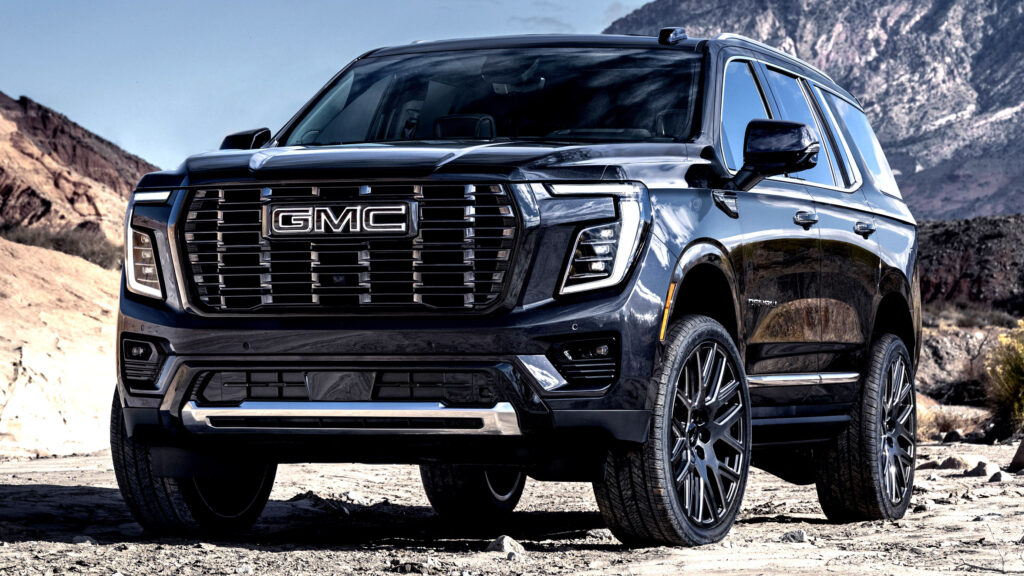
But Tesla, in sixth place, shows an impressive result of 4.6% chance of reaching 250,000 miles, sharing this position with GMC. This places it ahead of brands we are used to considering manufacturers of high-quality and durable cars, such as Cadillac, Mazda, Subaru, Volvo, Mercedes, BMW, and Porsche. Given the endless online discussions about battery degradation and replacement costs, this is a result you probably didn’t expect.
Looking back, perhaps this shouldn’t be so shocking. Electric vehicles have their own challenges, but they also eliminate a long list of components that traditionally wear out in gasoline-powered cars. There is no internal combustion engine, no oil changes, no timing chains, no injectors, and significantly fewer moving parts overall. Although battery condition remains a concern for some buyers, modern electric cars may have an easier path to extreme mileage than many assume.
Tesla Ranks Third Among Luxury Brands for Longevity


Chance of reaching 250,000 miles (Luxury Brands)
| Rank | Brand | % Chance of 250,000+ Miles | Compared to Average |
| 1 | Lexus | 12.8% | 4.0x |
| 2 | Acura | 7.2% | 2.3x |
| 3 | Tesla | 4.6% | 1.4x |
| 4 | Cadillac | 4.5% | 1.4x |
| 5 | Lincoln | 3.4% | 1.1x |
| Luxury | Average | 3.2% | — |
| 6 | Volvo | 2.2% | 0.7x |
| 7 | Infiniti | 2.1% | 0.7x |
| 8 | Mercedes-Benz | 1.7% | 0.5x |
| 9 | Buick | 0.6% | 0.2x |
| 10 | Porsche | 0.5% | 0.2x |
| 11 | BMW | 0.4% | 0.1x |
| 12 | Audi | 0.3% | 0.1x |
| 13 | Land Rover | 0.1% | 0x |
| 14 | Jaguar | 0.0% | 0x |
| 15 | Maserati | 0.0% | 0x |
The ranking of non-luxury brands shows just how dominant Toyota remains. Its figure is more than three times the segment average, while Honda is the only other mass-market brand to exceed the average level. After that, there is a significant gap to everyone else. Luxury brands tell a similar story. Lexus leads confidently, Acura is in second place, and Tesla joins Cadillac and Lincoln as the only other premium marques to surpass the average for the luxury segment.
As for the brands at the bottom of the list, some stereotypes seem to persist. Land Rover has a barely noticeable 0.1% chance of reaching 250,000 miles, while Jaguar and Maserati effectively have a zero percent figure. BMW, Audi, and Porsche fare little better.
Chance of reaching 250,000 miles (All Brands)
| Rank | Brand | % Chance of 250,000+ Miles | Compared to Average |
| 1 | Toyota | 17.8% | 3.7x |
| 2 | Lexus | 12.8% | 2.7x |
| 3 | Honda | 10.8% | 2.3x |
| 4 | Acura | 7.2% | 1.5x |
| Overall | Average* | 4.8% | — |
| 5 | GMC | 4.6% | 1.0x |
| 6 | Tesla | 4.6% | 1.0x |
| 7 | Chevrolet | 4.5% | 0.9x |
| 8 | Cadillac | 4.5% | 0.9x |
| 9 | Mazda | 3.6% | 0.7x |
| 10 | Ram | 3.5% | 0.7x |
| 11 | Lincoln | 3.4% | 0.7x |
| 12 | Ford | 3.1% | 0.7x |
| 13 | Dodge | 2.5% | 0.5x |
| 14 | Nissan | 2.4% | 0.5x |
| 15 | Subaru | 2.3% | 0.5x |
| 16 | Volvo | 2.2% | 0.5x |
| 17 | Infiniti | 2.1% | 0.4x |
| 18 | Mercedes-Benz | 1.7% | 0.4x |
| 19 | Jeep | 1.3% | 0.3x |
| 20 | Mitsubishi | 1.1% | 0.2x |
| 21 | Kia | 0.6% | 0.1x |
| 22 | Hyundai | 0.6% | 0.1x |
| 23 | Buick | 0.6% | 0.1x |
| 24 | Porsche | 0.5% | 0.1x |
| 25 | Chrysler | 0.5% | 0.1x |
| 26 | BMW | 0.4% | 0.1x |
| 27 | Volkswagen | 0.4% | 0.1x |
| 28 | Audi | 0.3% | 0.1x |
| 29 | Land Rover | 0.1% | 0x |
| 30 | Jaguar | 0.0% | 0x |
| 31 | MINI | 0.0% | 0x |
| 32 | Maserati | 0.0% | 0x |
Chance of reaching 250,000 miles (Non-Luxury Brands)
| Rank | Brand | % Chance of 250,000+ Miles | Compared to Average |
| 1 | Toyota | 17.8% | 3.5x |
| 2 | Honda | 10.8% | 2.1x |
| Non-Luxury | Average* | 5.1% | — |
| 3 | GMC | 4.6% | 0.9x |
| 4 | Chevrolet | 4.5% | 0.9x |
| 5 | Mazda | 3.6% | 0.7x |
| 6 | Ram | 3.5% | 0.7x |
| 7 | Ford | 3.1% | 0.6x |
| 8 | Dodge | 2.5% | 0.5x |
| 9 | Nissan | 2.4% | 0.5x |
| 10 | Subaru | 2.3% | 0.4x |
| 11 | Jeep | 1.3% | 0.3x |
| 12 | Mitsubishi | 1.1% | 0.2x |
| 13 | Kia | 0.6% | 0.1x |
| 14 | Hyundai | 0.6% | 0.1x |
| 15 | Chrysler | 0.5% | 0.1x |
| 16 | Volkswagen | 0.4% | 0.1x |
| 17 | MINI | 0.0% | 0x |
iSeeCars
This study highlights that perceptions of vehicle durability are gradually changing. Although traditional Japanese brands remain the undisputed leaders, Tesla’s high score suggests that electric vehicles may be much more reliable in the long term than commonly thought. The lack of complex mechanical components inherent in internal combustion engines gives them an advantage, although the issue of battery replacement cost remains a key factor for consumers. At the same time, the low positions of prestigious brands like BMW, Mercedes-Benz, and Porsche might make buyers looking for a car “for the ages” reconsider their priorities in favor of design simplicity, rather than prestige alone.