 by
by Overall Inventory Picture
New car inventories in the United States continue to grow, and, as we have become accustomed, there are several brands whose inventory levels significantly exceed the industry average. Stellantis remains one of the biggest “offenders,” with Chrysler having particularly large inventories.
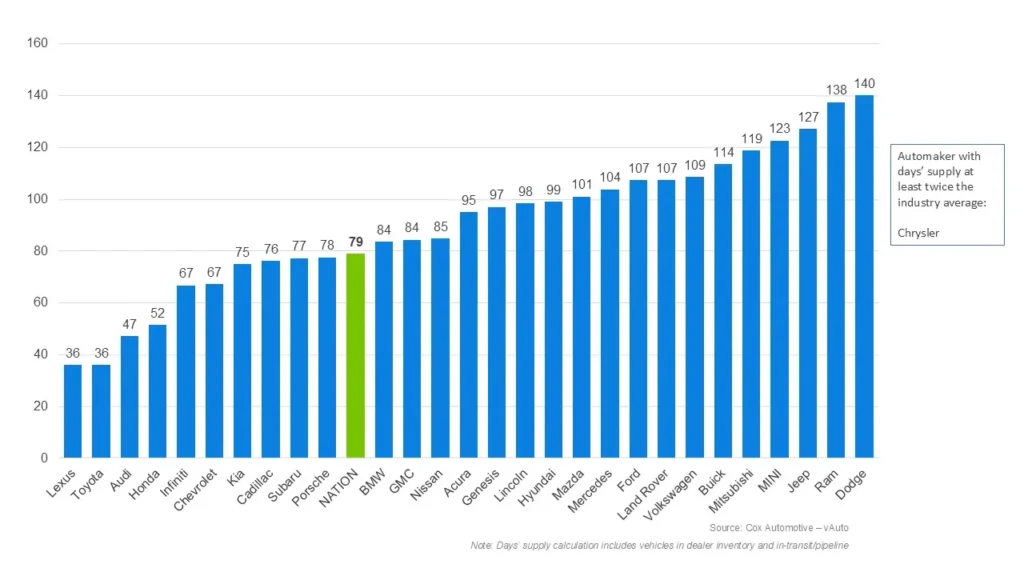
In March, the national average days’ supply was 79 days, significantly less than the 96 days in February and 94 days in January. Despite this, the total inventory volume increased by 1.3% from February to March of this year, reaching 2.89 million units according to Cox Automotive.
This total volume was also 6.1% higher than a year ago, partly explained by a surge in purchases in March 2025, which temporarily reduced inventory levels.
Chrysler and Stellantis Issues
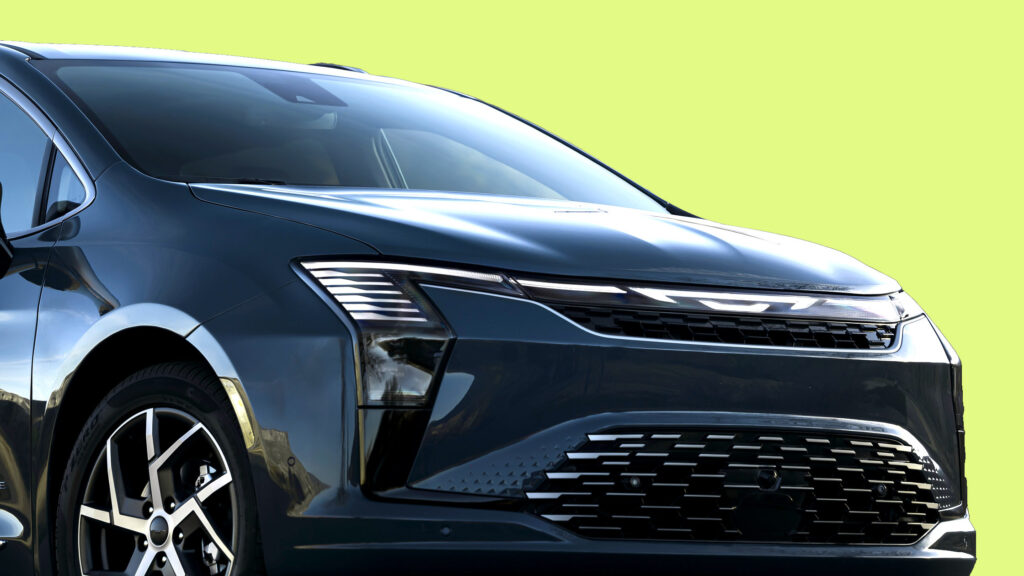
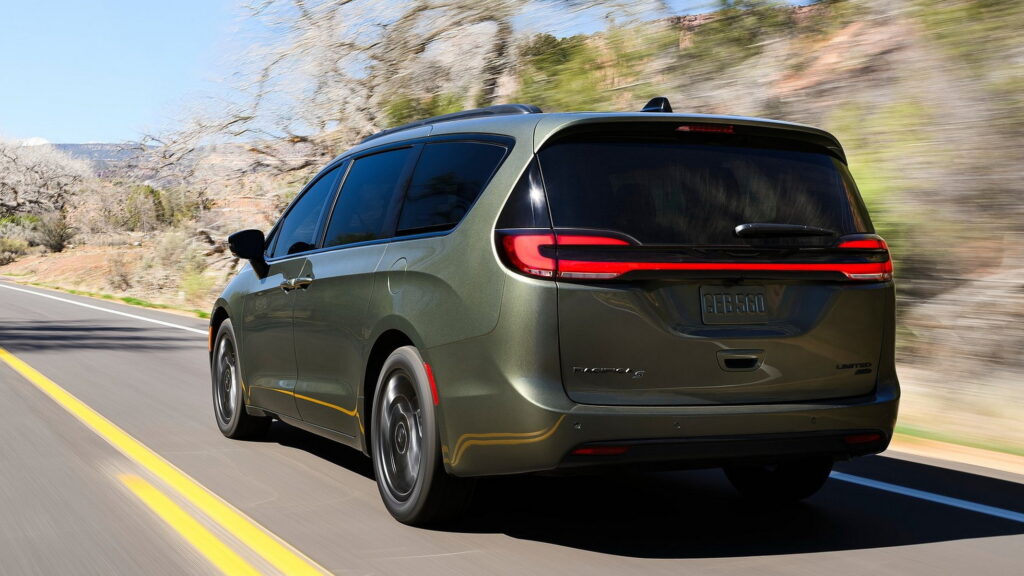
Chrysler’s inventories continue to swell. In March, they were at least double the industry average of 79 days. This is happening despite an outdated model lineup consisting solely of the Pacifica and Voyager, which is merely a more basic version of the same Pacifica that Chrysler has been producing for a decade. The minivan was recently updated with a front-end facelift, so a completely new model is not coming soon.
Chrysler is not the only Stellantis brand with growing inventories. Currently, Dodge has a 140-day supply, slightly ahead of Ram with 138 days and Jeep with 127 days. Among non-Stellantis brands, Mini has the highest days’ supply at 123 days, which is higher than Mitsubishi (119), Buick (114), and Volkswagen (109).
Low Inventory Leaders
At the other end of the spectrum are brands with inventories below the industry average. These include Porsche (78 days), Subaru (77 days), Cadillac (76 days), Kia (75 days), Chevrolet and Infiniti (67 days each), Honda (52 days), Audi (47 days), as well as Lexus and Toyota, both with a 36-day supply.
Sales and Price Dynamics
Cox Automotive data also notes that new car sales rebounded very strongly in March compared to January and February. Last month, 1.13 million new cars were sold nationwide, more than the 831,191 sold in the slow February. As sales grew, the average advertised price slightly fell to $48,667.
Dealers are increasingly relying on incentives to maintain sales pace, with the average spending on them rising to $3,541 per car in March, or 7.2% of the average transaction price.
Historical Inventory Data
The table below illustrates the dynamics of inventories, sales, and prices over recent months:
| Month | Inventory Volume | Days’ Supply | Sales | Avg. Advertised Price |
| March 2025 | 2,725,005 | 71 | 1,187,840 | $47,874 |
| April 2025 | 2,641,748 | 68 | 1,167,187 | $48,406 |
| May 2025 | 2,560,104 | 74 | 1,078,445 | $48,739 |
| June 2025 | 2,816,717 | 84 | 1,012,492 | $48,673 |
| July 2025 | 2,707,559 | 77 | 1,094,241 | $48,496 |
| August 2025 | 2,730,357 | 75 | 1,133,566 | $48,566 |
| September 2025 | 2,855,668 | 87 | 990,819 | $49,057 |
| October 2025 | 3,005,433 | 90 | 1,039,591 | $49,193 |
| November 2025 | 3,053,128 | 90 | 1,017,139 | $49,454 |
| December 2025 | 2,967,543 | 86 | 1,076,180 | $50,351 |
| January 2026 | 2,741,173 | 94 | 908,330 | $49,594 |
| February 2026 | 2,854,721 | 96 | 831,191 | $49,170 |
| March 2026 | 2,890,423 | 79 | 1,130,991 | $48,667 |
This data clearly shows that the situation with excess inventories, especially for certain automakers, is not accidental but has a persistent nature. The difference between brands like Toyota and Chrysler, measured in hundreds of percent by the days’ supply metric, points to deeper structural problems in model lineup management and marketing strategy. The increased use of sales incentives may temporarily support turnover but does not solve the root cause—insufficient market demand for specific models. In the long term, such an imbalance could lead to additional financial pressure on dealers and manufacturers due to inventory devaluation and reduced profitability.